eBay Price History: How to See What an Item Sold For Over Time
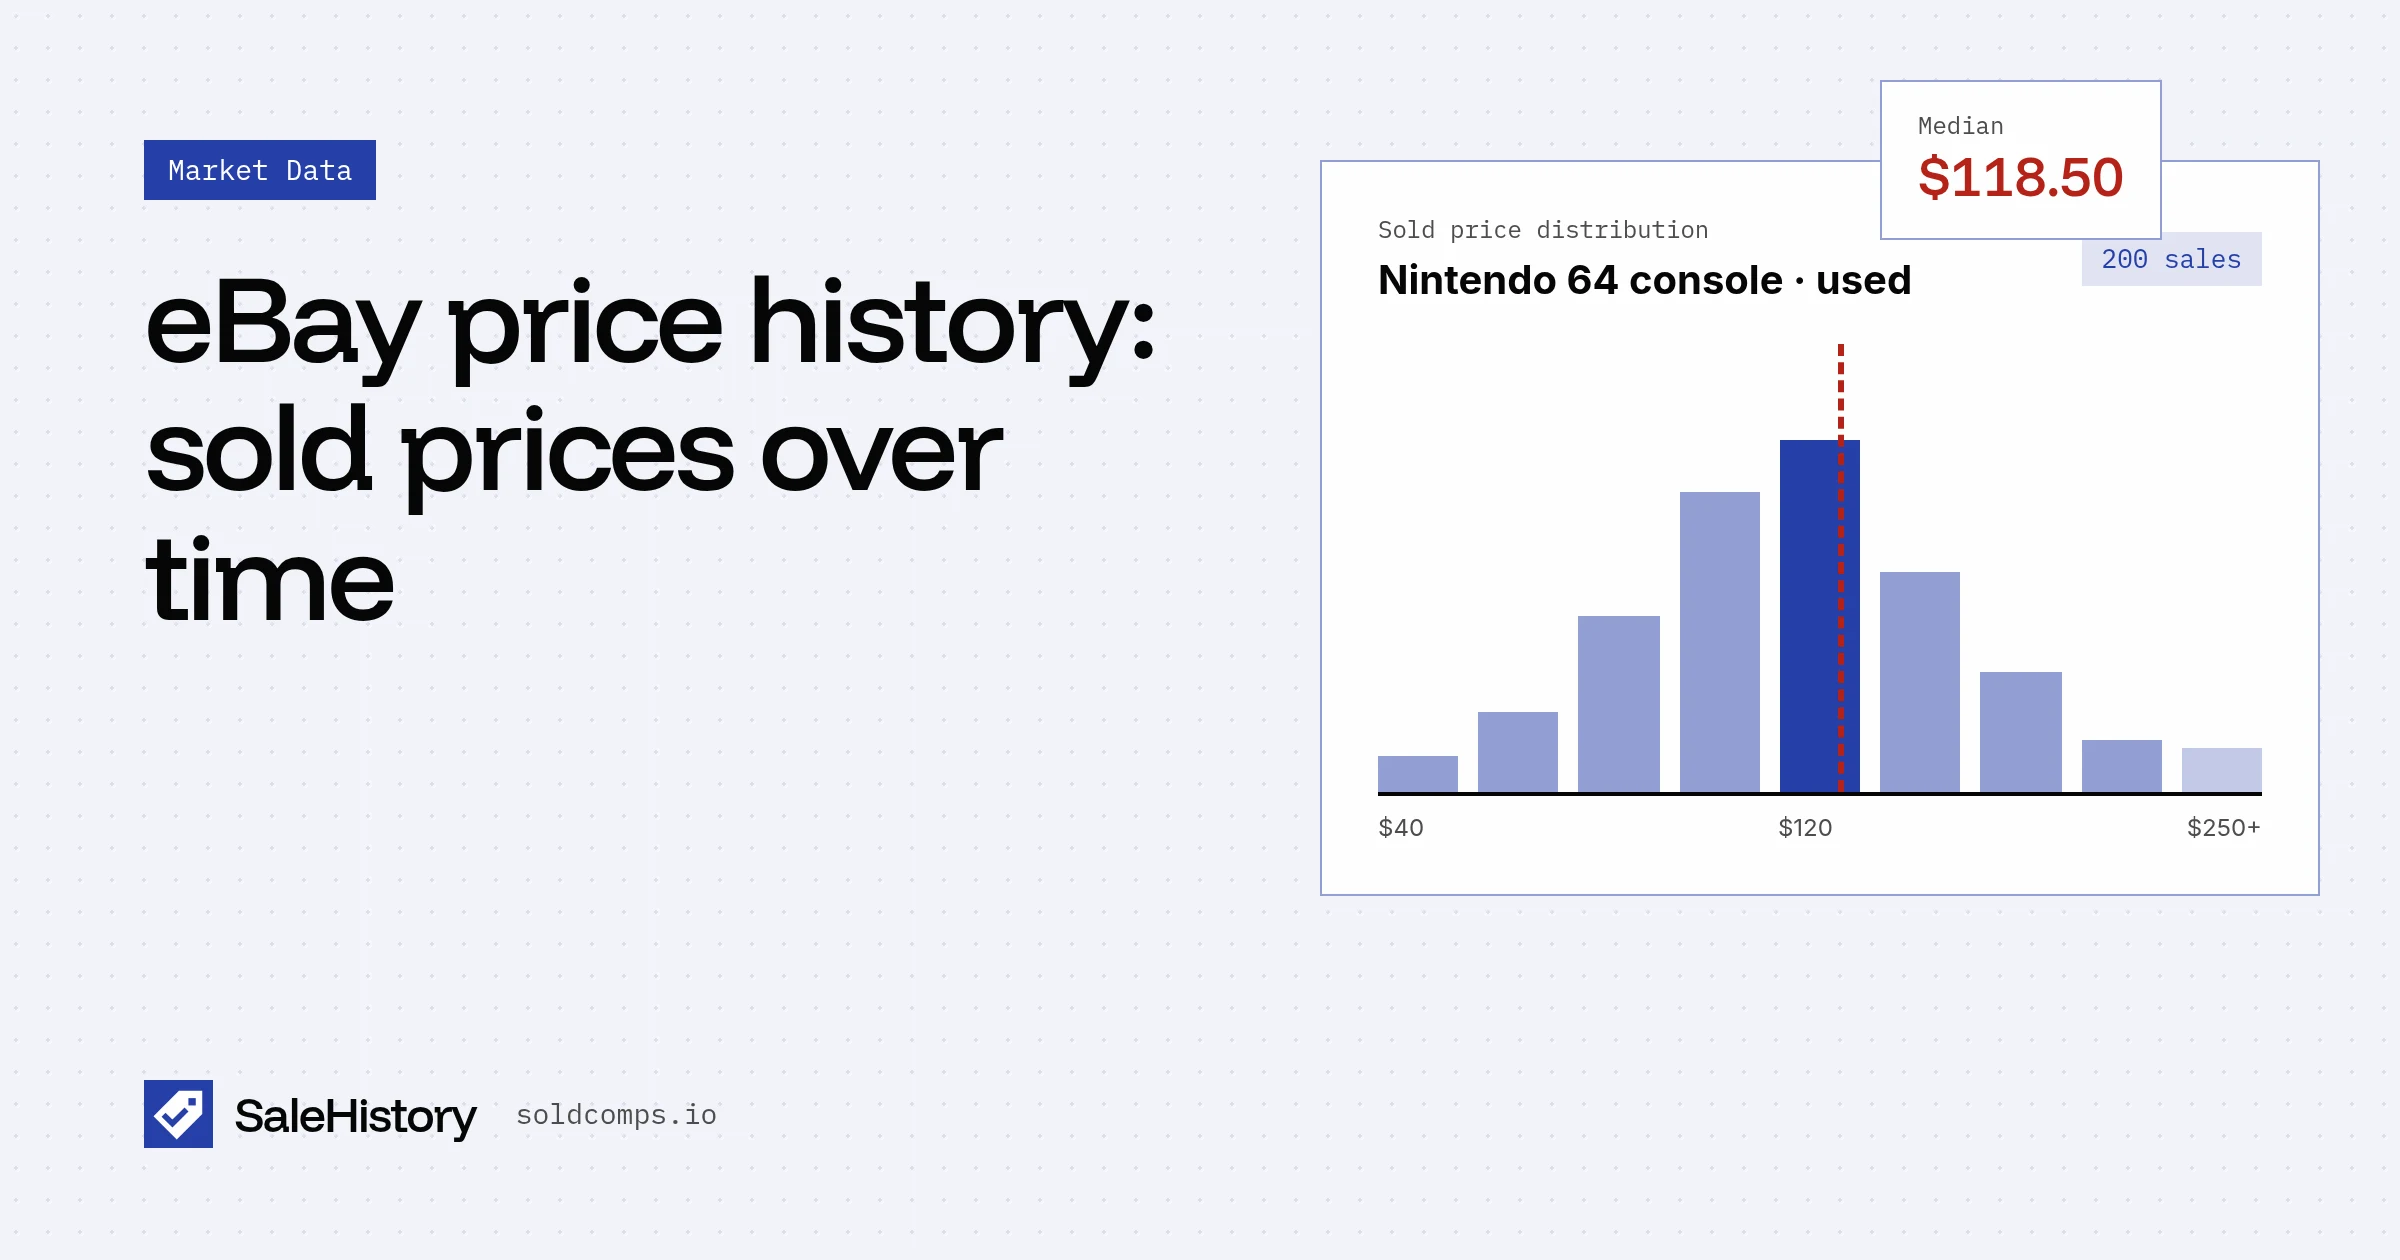
"I know this item has been sold a bunch before then, and it seems this 3-month limit is the case with all items." That's one seller hitting the wall everyone eventually hits: eBay forgets its sales after about 90 days.
Here's what each option actually gives you, and the one that only gets better with time.
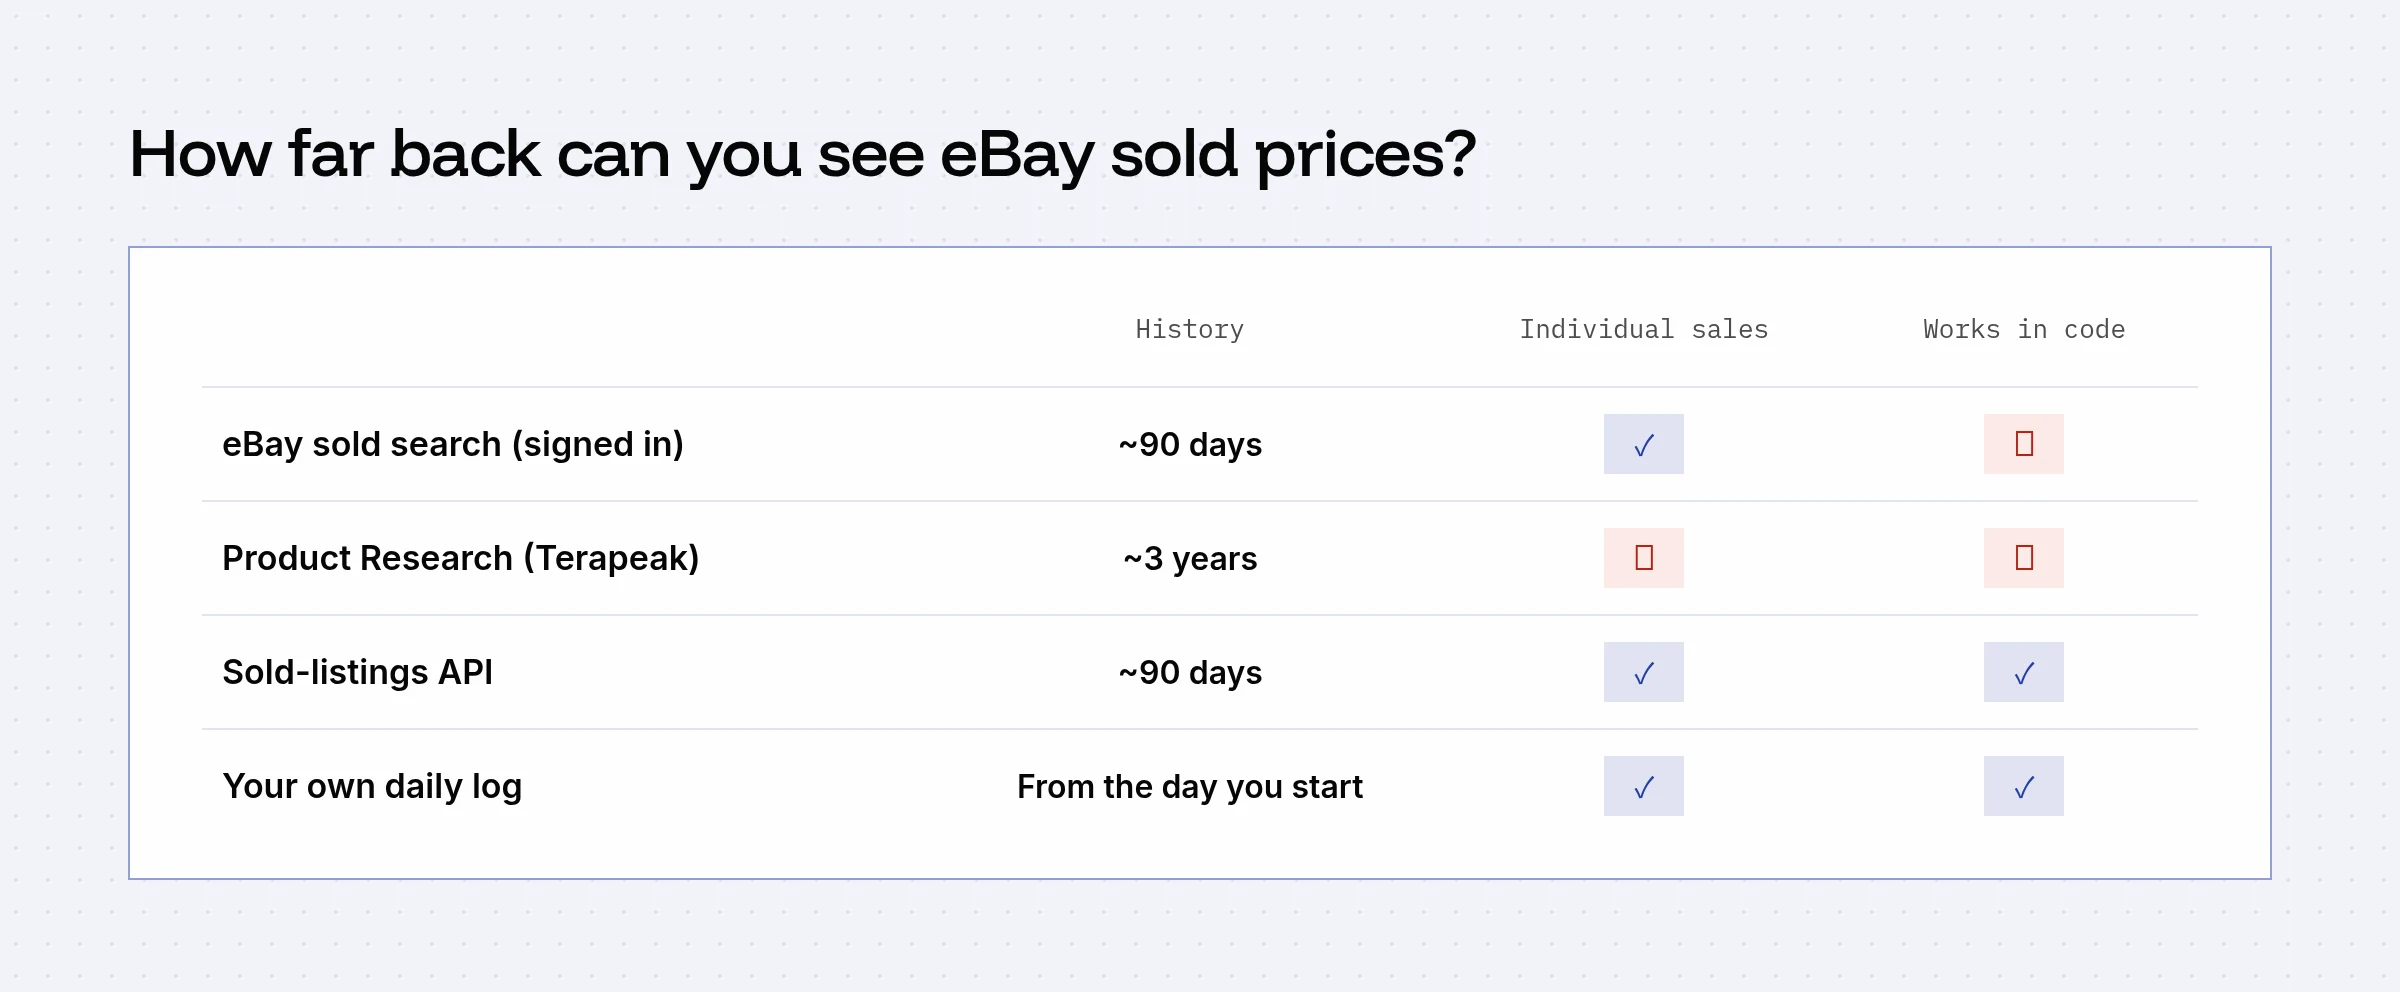
Option 1: eBay sold search (~90 days)
Sign in, search, tick Sold items. You see individual sales with prices and dates, going back roughly 90 days. It's free and precise, but short. Step by step.
Option 2: Product Research / Terapeak (~3 years)
eBay's Product Research, still widely called Terapeak, lives in Seller Hub and goes back about three years. It's free with a seller account. The catches:
- Averages, not sales. You see average sold price and totals, not each sale's price, date and condition.
- No export or API. It's a screen, not data you can keep. More on that.
It's the best free way to eyeball a long trend for one item.
Option 3: Start your own price history today
Nobody gives away long sold history in a usable form. But nothing stops you from keeping it yourself. Log the median sold price for the items you care about once a day or once a week. In three months you have more history than eBay shows. In a year, you have a price chart nobody else has.
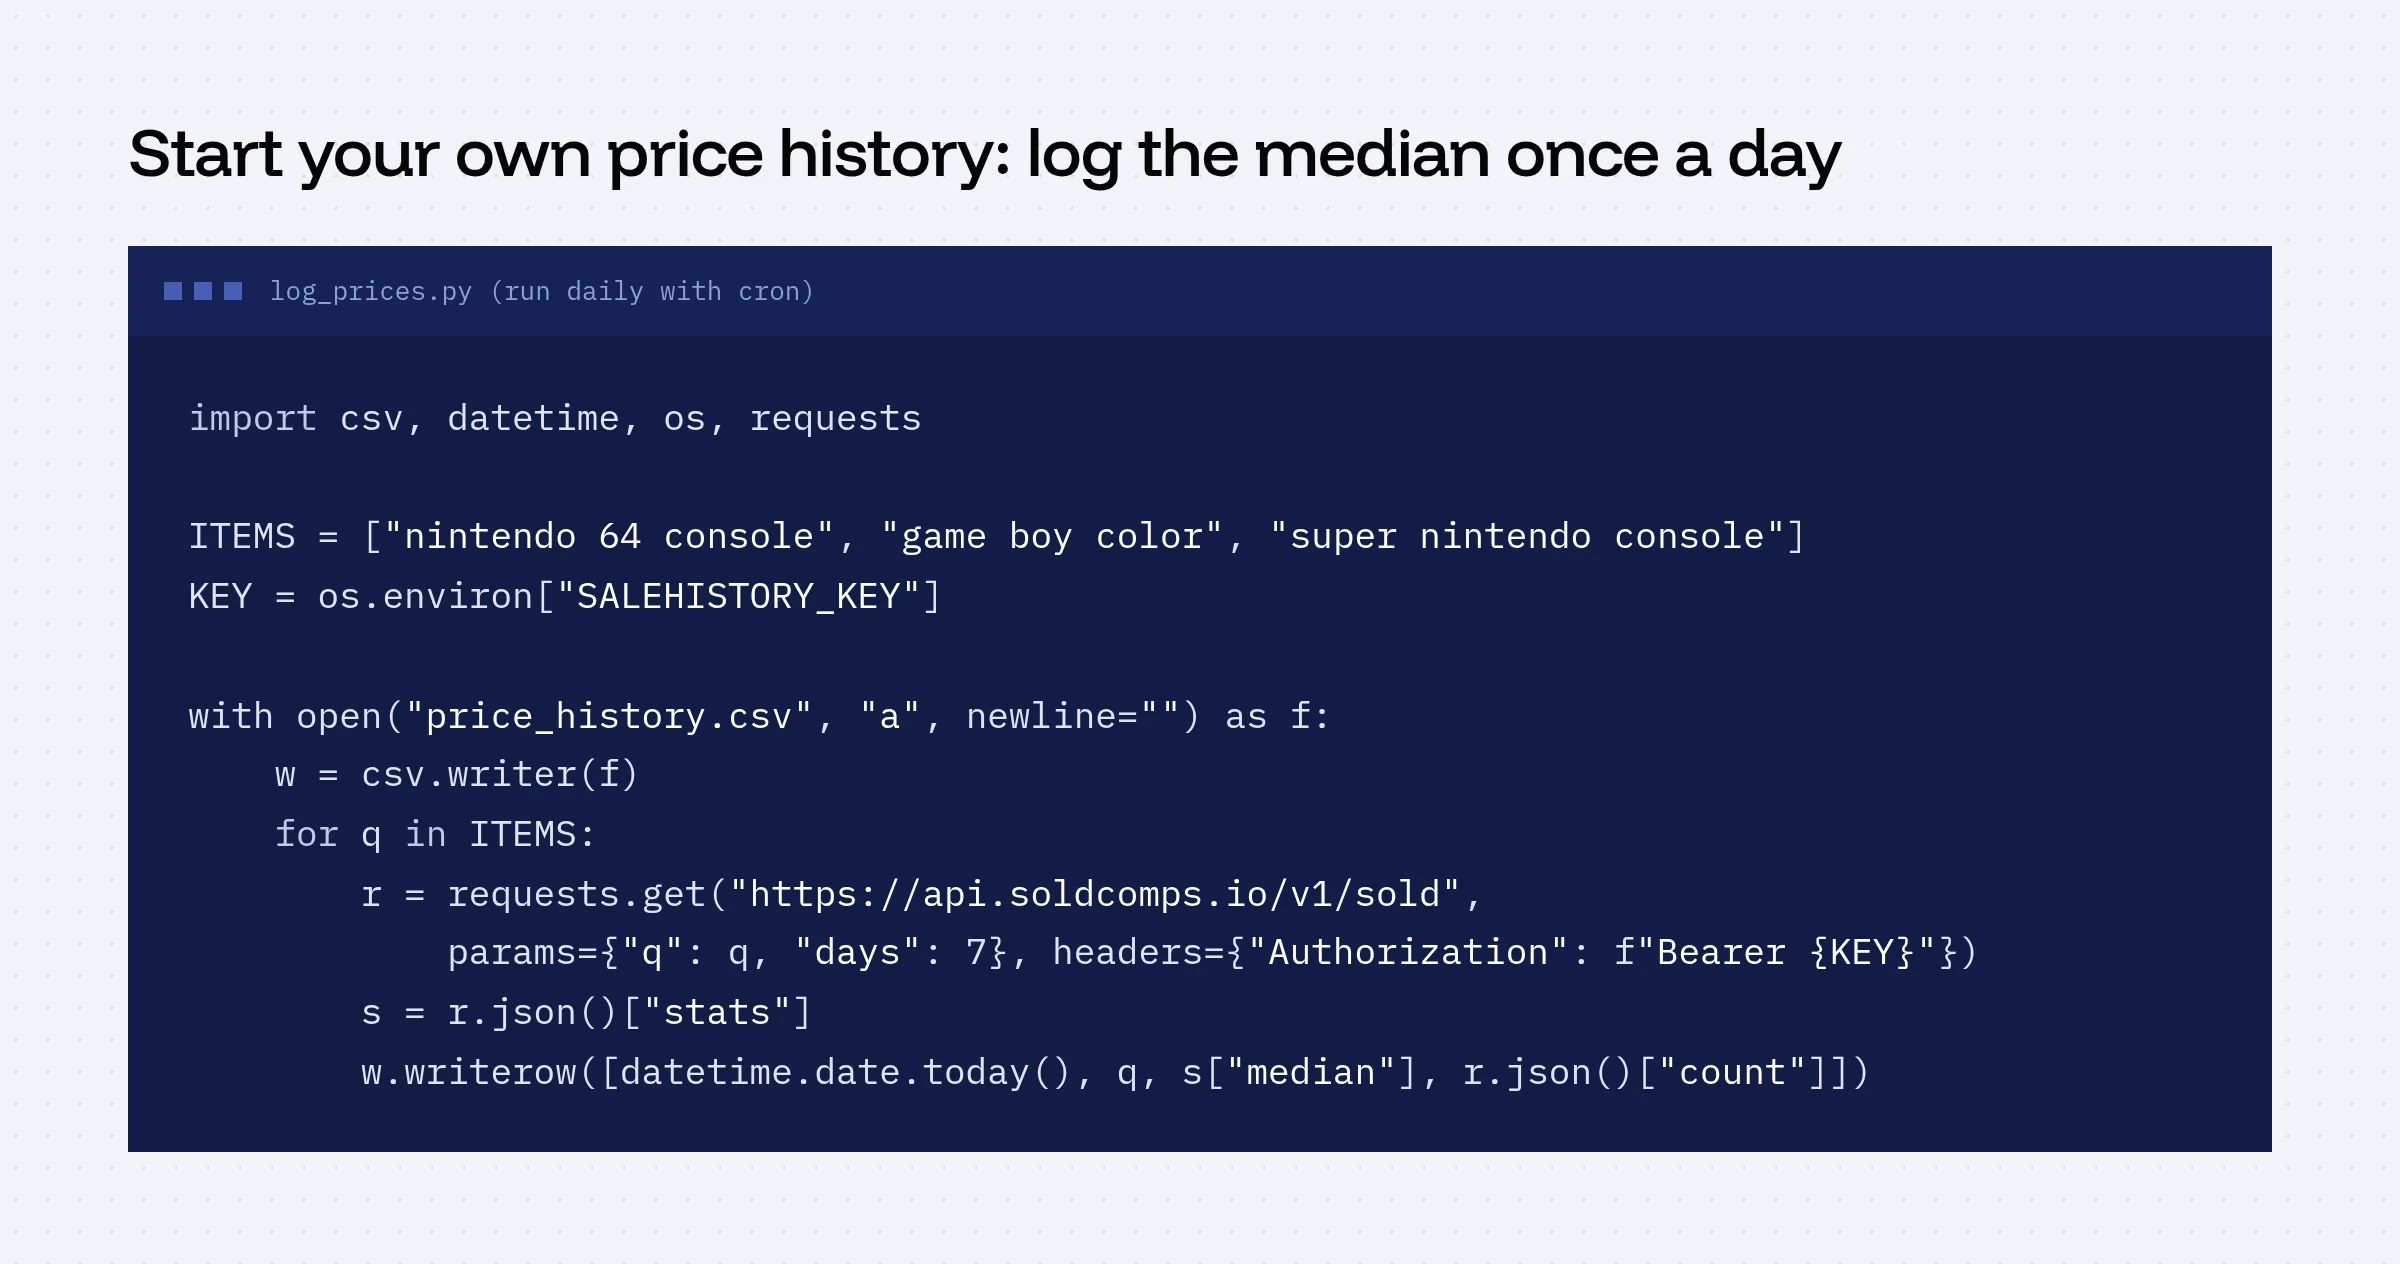
The full script:
import csv, datetime, os, requests

ITEMS = ["nintendo 64 console", "game boy color", "super nintendo console"]
KEY = os.environ["SALEHISTORY_KEY"]

with open("price_history.csv", "a", newline="") as f:
    w = csv.writer(f)
    for q in ITEMS:
        r = requests.get(
            "https://api.soldcomps.io/v1/sold",
            params={"q": q, "days": 7},
            headers={"Authorization": f"Bearer {KEY}"},
            timeout=30,
        )
        d = r.json()
        w.writerow([datetime.date.today(), q, d["stats"]["median"], d["count"]])
Schedule it with cron (or a GitHub Action), then open the CSV in Google Sheets and insert a line chart. Using days: 7 means each point is the median of that week's sales, so the chart reflects what's happening now rather than a 90-day blur.
Prefer no code? The Google Sheets formula does the same thing. Add a dated row per week.
Why short windows matter too
Long history tells you the trend. Short windows tell you the current price. Card investors say it bluntly: "it needs to be more like a 2- or 3-week average in the current market rather than 3 months." When a market is moving, compare the last 7–14 days against the 90-day median:
- 7-day median well above the 90-day: prices are rising. Don't underprice.
- 7-day median well below: prices are falling. Sell sooner, buy more cautiously.
Frequently asked questions
How far back does eBay sold history go?
About 90 days in eBay's sold search. Signing in doesn't extend it. Product Research (Terapeak) in Seller Hub goes back about three years but only shows averages.
How do I see eBay sold prices older than 90 days?
Use Product Research in Seller Hub if you have a seller account, or start keeping your own log of sold prices. Once a sale scrolls past 90 days it disappears from eBay's sold search.
Is there an eBay price history chart?
Product Research shows trend charts of average sold price for up to about three years. eBay's normal search does not chart prices. For a chart of your own items, log the median sold price regularly and chart it in a spreadsheet.
Why do prices in the last 2 weeks matter more than 90 days?
In fast-moving markets like trading cards, prices can shift in weeks. A 90-day median can lag. Check a shorter window, such as the last 7 or 14 days, alongside the 90-day number.
Sources
- eBay UK Seller Centre: Product Research (three years of sales data) (accessed Oct 22, 2026)
- r/Ebay: The 3-month limit on sold listings (Jan 2026) (accessed Oct 22, 2026)
- r/PokeInvesting: Comp window too long for a volatile market (Sep 2026) (accessed Oct 22, 2026)
SaleHistory sells an eBay sold-listings API, so we have a commercial interest in this topic. We link primary sources so you can check our work. Spotted something out of date? Email hello@soldcomps.io.