eBay Sold Comps Statistics: 1 in 3 Sold Results Can't Be Used at Face Value
Everyone who prices used goods uses eBay sold listings. Very few people know how much of what eBay shows as "sold" is actually usable. We measured it.
We pulled the most recent sold listings for 43 common searches, from Pokémon cards to KitchenAid mixers, and classified every one of the 5,779 results. Here's what we found. Every number below can be quoted, and the method is at the end.
Key findings
- 31.5% of eBay sold results can't be used as a comp at face value. Of 5,779 sold listings, 1,823 were lots, for-parts sales, accessories, outliers or Best Offers with a hidden price.
- 19.5% of eBay sold listings are accepted Best Offers whose real price is hidden. In every one of them, the price shown was the asking price, not what the buyer paid.
- 13.9% of eBay sold results are a different thing from what you searched for: a lot or bundle (4.6%), a for-parts or broken item (4.0%), a statistical outlier (4.0%) or an accessory (1.1%).
- A raw average of eBay sold prices overstates the clean median by 19% in a typical search. In 60% of searches, the raw average was more than 10% above the clean median. In graded cards it was more than four times higher.
- Auctions sold for a median 18% less than Buy It Now sales of the same search. Auctions were lower in 28 of 34 searches.
- The middle half of sold prices for a typical search spans 1.84×, from the 25th to the 75th percentile. Electronics were the tightest (1.30×) and trading cards the widest (2.65×).
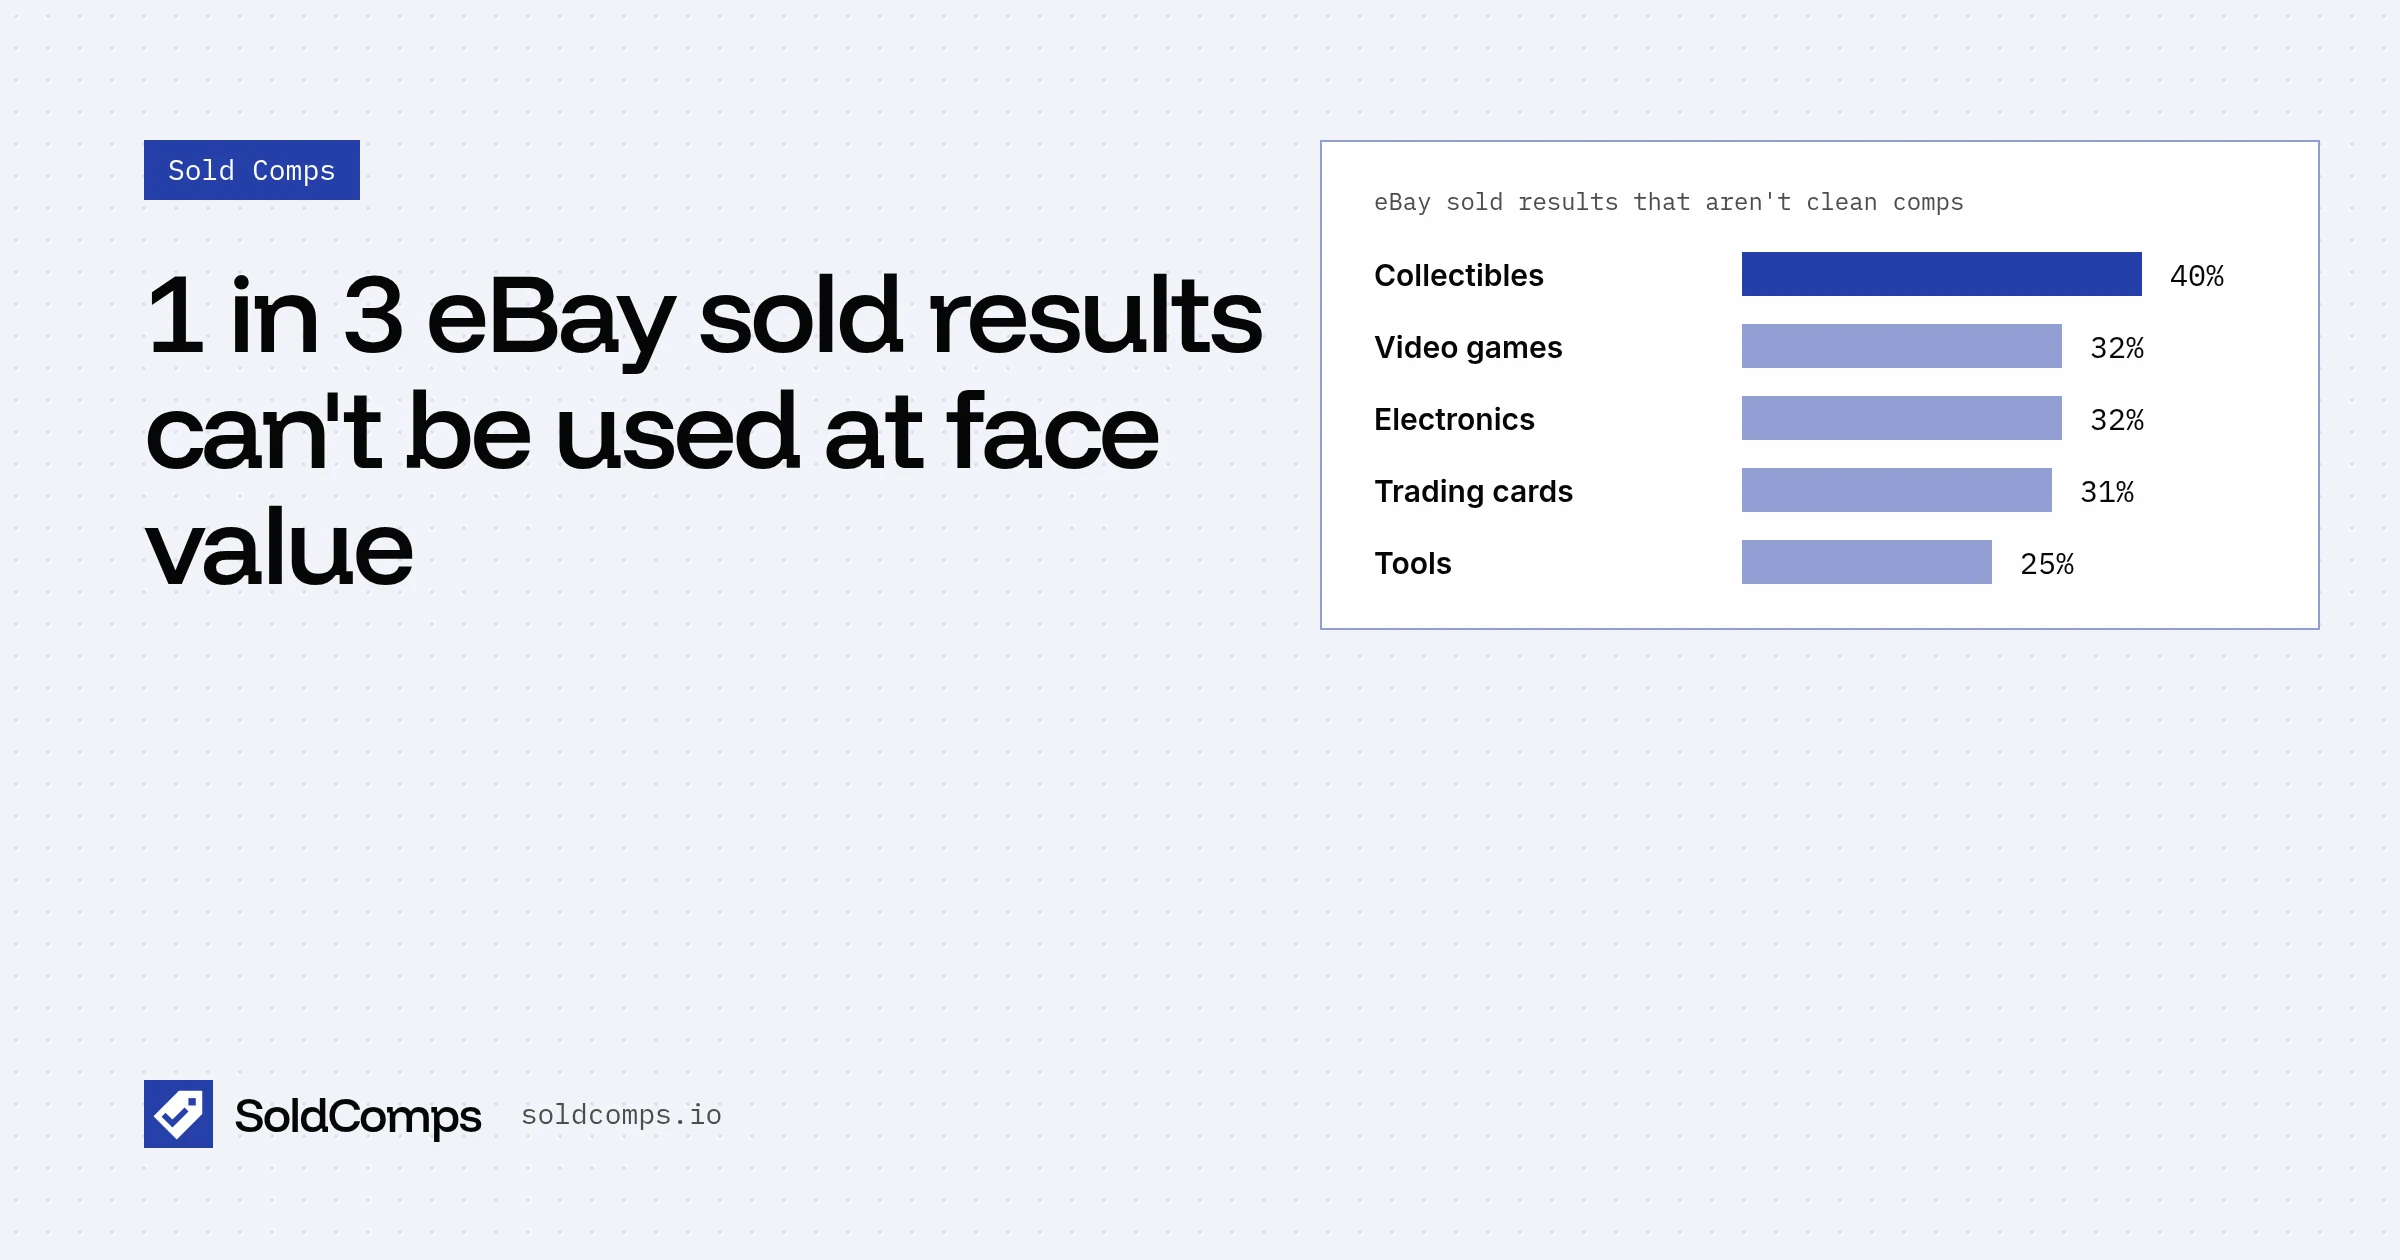
How many sold results aren't clean comps, by category
| Category | Sold listings | Not usable at face value | Lots | For parts | Hidden Best Offer |
|---|---|---|---|---|---|
| Collectibles & vintage | 812 | 40.3% | 12.3% | 5.3% | 20.2% |
| Video games | 686 | 32.2% | 6.9% | 12.2% | 13.6% |
| Electronics | 665 | 31.6% | 5.9% | 11.0% | 12.2% |
| Clothing & bags | 804 | 31.6% | 0.9% | 0.0% | 27.7% |
| Trading cards | 494 | 31.0% | 5.3% | 0.4% | 18.4% |
| Home & kitchen | 879 | 30.9% | 2.8% | 3.2% | 19.2% |
| Sneakers | 675 | 28.1% | 1.3% | 0.0% | 25.5% |
| Watches | 167 | 26.9% | 0.0% | 1.2% | 22.8% |
| Tools | 597 | 25.3% | 2.5% | 3.7% | 16.1% |
| All | 5,779 | 31.5% | 4.6% | 4.0% | 19.5% |
"Not usable at face value" also includes outliers and accessories, so rows add up to more than the columns shown.
The problem changes with the category:
- Electronics and video games are full of broken units. 11% to 12% of sold results were for-parts or untested sales, which can sell for a fraction of a working one.
- Collectibles are full of lots. One in eight collectibles results was a bundle, and for "lego 75192" it was a third of all sold results (33.7%).
- Clothing, bags and sneakers have almost no lots or broken items, but more than a quarter of sales were Best Offers with the real price hidden.
Hidden Best Offer prices
When a listing ends in an accepted Best Offer, eBay's sold results show the seller's asking price with a "Best offer accepted" label. In our sample, the accepted amount was not shown for a single one of the 1,127 Best Offer sales.
That matters because Best Offers almost always close below the asking price. Use those listings at face value, and your comp is biased upward. How to read Best Offer sold prices covers how to spot them.
| Category | Best Offer sales with hidden price |
|---|---|
| Clothing & bags | 27.7% |
| Sneakers | 25.5% |
| Watches | 22.8% |
| Collectibles & vintage | 20.2% |
| Home & kitchen | 19.2% |
| Trading cards | 18.4% |
| Tools | 16.1% |
| Video games | 13.6% |
| Electronics | 12.2% |
Averages vs medians
We compared the plain average of every sold price in a search with the median of clean sales only.
- In a typical search, the raw average was 19% higher than the clean median.
- In 60% of searches it was more than 10% higher. In only 5% was it more than 10% lower.
- The worst cases were graded and rookie cards: the raw average was 4.6× the clean median for "charizard psa 10" and 4.6× for "topps chrome rookie auto", because a few very high sales of rarer cards pull the average up.
This is why every serious comp uses the median. The full explanation is in median vs average sold price.
Auction vs Buy It Now
For the 34 searches with at least five clean auction sales and five clean fixed-price sales, we compared the two medians.
- Auctions were lower in 28 of 34 searches, and the typical auction median was 82% of the Buy It Now median.
- The biggest gaps were in fashion and sneakers, where auctions are often used to dump stock: New Balance 550 auctions sold at 26% of the Buy It Now median, and Coach Tabby bags at 39%.
- The exceptions were collectibles with bidding wars: Topps Chrome rookie autos (1.73×), One Piece booster boxes (1.66×) and Hot Wheels Redlines (1.49×) sold higher at auction.
Auction and Buy It Now sales in one search can also differ in condition and version, so treat this as a market-level pattern, not a rule for every item. More in auction vs Buy It Now sold prices.
How wide sold prices run
The spread is the 75th percentile divided by the 25th percentile of clean sales: how far apart the middle half of buyers were.
| Category | Typical spread (p75 ÷ p25) |
|---|---|
| Electronics | 1.30× |
| Video games | 1.75× |
| Clothing & bags | 1.83× |
| Watches | 1.91× |
| Home & kitchen | 1.95× |
| Sneakers | 2.05× |
| Collectibles & vintage | 2.26× |
| Tools | 2.35× |
| Trading cards | 2.65× |
| All searches | 1.84× |
Standardized products with a model number (consoles, phones, laptops) have tight spreads. Anything where condition, version, grade or size varies has a wide one. A wide spread usually means the search needs narrowing, not that the market is random. See how many sold comps you need.
Method
- Source: eBay US (ebay.com) completed sales, retrieved through the SoldComps API on Oct 30, 2026. Each search returned the most recent sold listings, up to 200, from the last 90 days. Sales in the sample are dated Aug 1 to Oct 30, 2026.
- Searches: 43 keyword searches across 9 categories, written the way a reseller would type them (for example "nintendo switch oled", "le creuset dutch oven 5.5", "charizard psa 10"), with no condition filter.
- Sample: 5,779 sold listings.
- Classification: each listing was checked by rules applied to its title, condition and price.
- Lot: several items sold together.
- For parts: broken, untested or for repair.
- Box only: packaging without the item.
- Replica: described as fake, replica or homage.
- Accessory: a part or add-on far below the typical price.
- Outlier: more than 1.5× the interquartile range from the middle.
- Hidden Best Offer: sold via accepted Best Offer with no accepted price shown.
- Clean median: the median of listings with none of those flags.
- Limits: this is a sample of common searches, not all of eBay. The search terms shape the results: vaguer searches catch more lots and accessories. Rule-based classification makes some mistakes. Category figures with fewer than 1,000 listings, especially watches (167), are rough.
You can reproduce any row: look up the same search in the free sold comps lookup, which applies the same rules and shows each listing with the reason it was left out.
Citing this page
Please cite as: SoldComps, "eBay Sold Comps Statistics", Oct 30, 2026, sample of 5,779 eBay US sold listings, linking to this page. We'll keep this URL stable and add dated updates rather than replacing figures.
The takeaway for anyone pricing from eBay: a sold listing is evidence, not an answer. About a third of them need to be thrown out or adjusted before you take a median. That's the work a good sold comps tool should do for you.
Frequently asked questions
What share of eBay sold listings are good comps?
In our sample of 5,779 eBay US sold listings, 68.5% could be used as a comp at face value. The other 31.5% were lots, for-parts sales, accessories, outliers, or accepted Best Offers where the price shown wasn't what the buyer paid.
How often do eBay sold listings hide the real Best Offer price?
In our sample, 19.5% of sold listings were accepted Best Offers, and in every one of them eBay showed the asking price rather than the accepted amount. Clothing, bags and sneakers had the highest rates, at 26% to 28%.
Do auctions sell for less than Buy It Now on eBay?
Usually. In 28 of 34 searches with at least five of each, the median auction sold for less than the median Buy It Now sale. Across those searches, auctions typically sold for 18% less. Cards and vintage collectibles were the main exceptions.
Can I cite these numbers?
Yes. Please link to this page as the source, and include the sample size and dates (5,779 eBay US sold listings, Aug 1 to Oct 30, 2026). The method is described below.
Sources
- SoldComps sample: 43 eBay US sold searches, 5,779 listings, sold Aug 1 to Oct 30, 2026 (method below) (accessed Oct 30, 2026)
- eBay Community: Best Offer Accepted sold comps displaying weird (accessed Oct 30, 2026)
SoldComps sells an eBay sold-listings API, so we have a commercial interest in this topic. We link primary sources so you can check our work. Spotted something out of date? Email hello@soldcomps.io.