Sold Comps for Market Research: Check Demand Before You Buy Inventory
Before you order 50 units of something, put money into a sourcing trip, or build a business around a product line, you want to know two things: will it sell, and at what price?
Most people guess from asking prices, which are just what sellers hope for. Sold comps are better: they show what buyers actually paid. And because eBay records completed sales across nearly every category, they're a free, deep and current read on resale demand.
Here's a simple framework for using them, with real numbers.
The four numbers to check
For any product you're considering, look at recent eBay sold listings and measure:
- Speed: how many sales per day.
- Agreement: how wide the middle range of prices is.
- Noise: how much of the market is lots, parts, empty boxes and fakes.
- Margin: whether the median leaves room over your landed cost after fees.
A product that's fast, tight, clean and profitable is a good bet. A product that's slow, wide and noisy is a gamble, even if the median looks great.
Real comparison: four products
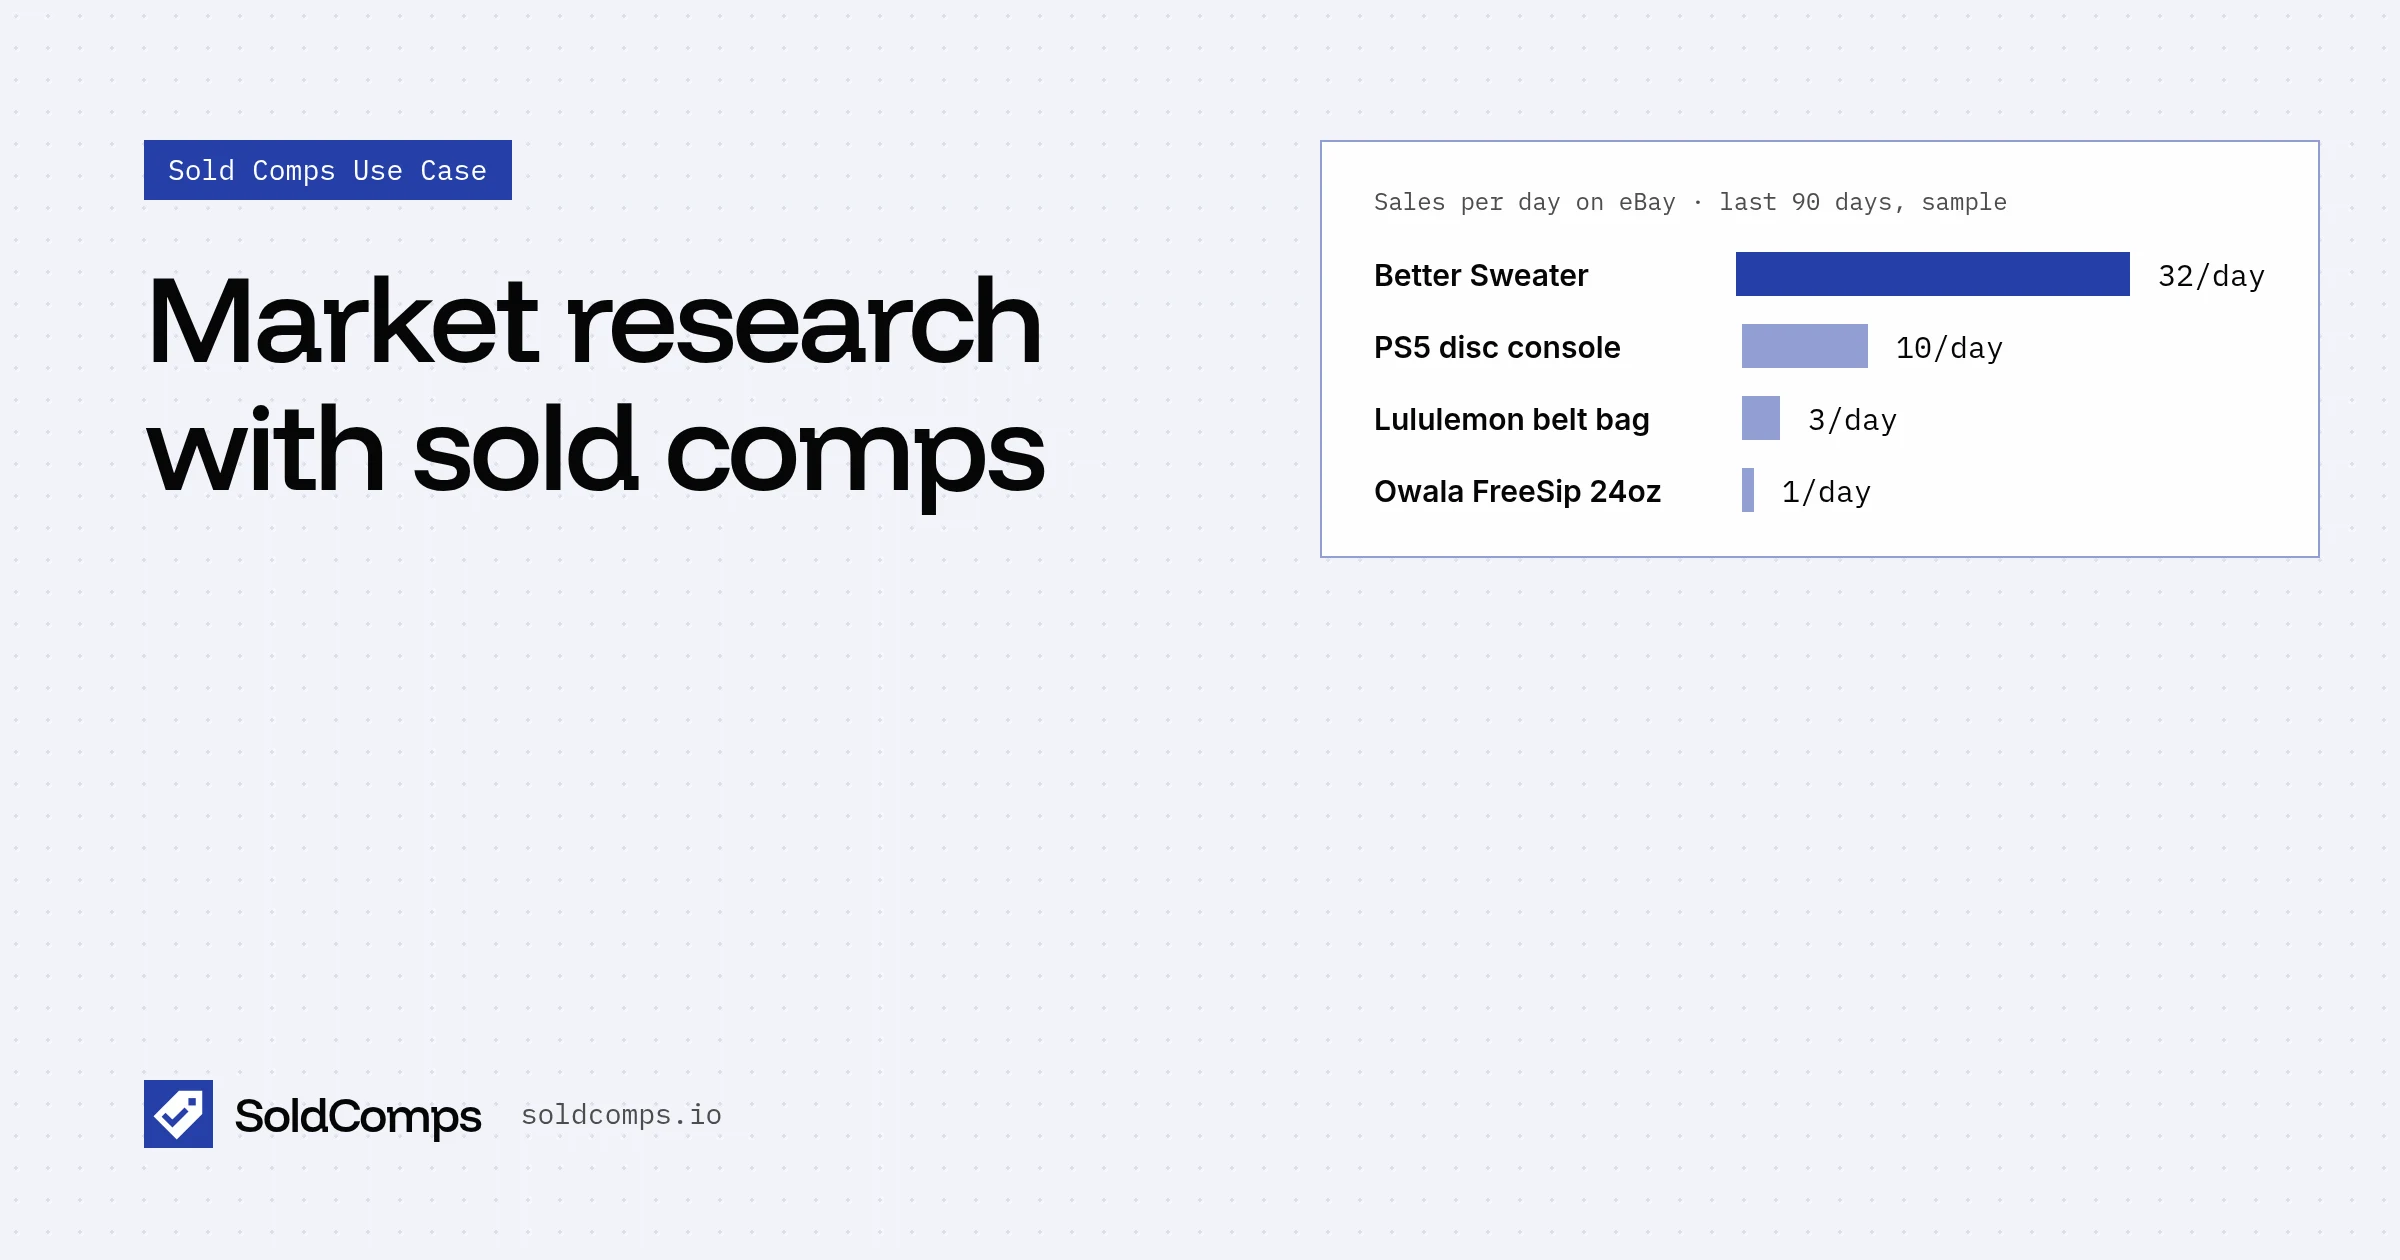
eBay US sold listings, last 90 days, pulled Oct 30, 2026. "Sales per day" is the number of sales in our sample divided by the days it covers. Our lookups return up to 200 of the most recent sales, so very fast products hit that cap within days. Read the speed as "at least".
| Product | Sales in sample | Days covered | Sales per day | Median | Middle half | Spread (p75 ÷ p25) | Left out |
|---|---|---|---|---|---|---|---|
| Patagonia Better Sweater | 190 | 6 | ~32 | $35.28 | $26–$47.71 | 1.8× | 38% |
| PlayStation 5 (disc) | 177 | 17 | ~10 | $450 | $427.50–$499.99 | 1.2× | 28% |
| Lululemon Everywhere Belt Bag | 175 | 66 | ~3 | $29 | $22.70–$38 | 1.7× | 25% |
| Owala FreeSip 24 oz | 59 | 69 | <1 | $27.99 | $24.99–$34.99 | 1.4× | 24% |
| Stanley Quencher 40 oz | 46 | 11 | ~4 | $39.95 | $21.99–$65 | 3.0× | 20% |
"Left out" is the share of sales excluded from the stats as lots, for-parts, box-only, replica or outlier listings.
What the numbers say
PS5: fast and tight. Ten sales a day, and the middle half of buyers paid within about $70 of each other. That's a liquid market with an agreed price. The risk isn't demand, it's margin: you need to buy well under $450 to make anything after fees.
Patagonia Better Sweater: very fast, moderate spread. Thirty-plus sales a day means it moves. The spread comes from sizes, colors, and men's vs women's versions. Research at the size and color level before stocking up.
Lululemon belt bag: steady. A few sales a day at a tight-ish range. Predictable, but a $29 median doesn't leave much once fees and shipping come out.
Owala FreeSip: slow on the resale market. Under one sale a day. The price range is tight, so buyers agree on value, but there just aren't many of them buying secondhand. That's a signal to avoid, or to buy only at a deep discount.
Stanley Quencher: noisy. A 3× spread between the low and high end of the middle half means "Stanley Quencher 40 oz" isn't one product. Limited colors and collaborations sell high, everyday colors sell low, and fakes are common. The median tells you almost nothing until you narrow the search to a specific color or edition.
Speed: is anyone buying?
Sales per day is the closest thing to a demand number you'll get for free. It's simple: count the sales, divide by the days.
Speed alone doesn't tell you how crowded the market is. A product can sell 10 a day and still have 500 active listings competing for those buyers. For that, compare sold listings with active ones. That ratio is the eBay sell-through rate, and resellers commonly treat 50% or higher as a fast seller.
Agreement: do buyers agree on a price?
The middle range (25th to 75th percentile) is where the middle half of sales landed. Divide the top by the bottom to get a quick spread ratio:
- Under 1.5×: buyers agree. You can predict your selling price.
- 1.5× to 2×: some variation. Narrow by size, color or condition.
- Over 2×: you're probably looking at several different products under one name. Narrow the search before you trust anything.
Always use the median, not the average. One $400 sale of a rare colorway can drag an average far from what a normal unit sells for. Median vs average sold price explains why.
Noise: how messy is the market?
A high share of lots, for-parts listings and replicas tells you something:
- Lots and bundles: sellers are dumping volume, often because single units don't sell well.
- Replicas: fakes compete with genuine items, and buyers get cautious.
- For-parts: the product breaks often enough to have a secondary market for broken units.
None of these kill a product. They do mean you need tighter searches, and you should expect more buyer questions and returns.
Margin: will it pay?
Last, check the money:
margin = median sold price − 13.6% eBay fee − $0.40 − shipping − your landed cost
13.6% plus $0.40 per order is eBay's final value fee in most categories; check your category. If your margin only works at the top of the range, it doesn't work. Run the numbers at the 25th percentile too.
Beyond flipping
The same four numbers are useful well outside reselling:
- Wholesale and liquidation buyers use them to value a manifest before bidding. See pricing a liquidation pallet.
- Brands and product teams check how their products hold value on the secondary market, and which colors or versions are in demand.
- Analysts track a product's median sold price week by week to see where the market is heading. eBay price history covers ways to see older data.
Researching many products at once
Comparing two products by hand is fine. Comparing 200 is not. A free sold comps lookup gives you the median, middle range, count and exclusions for one search at a time. For a whole list, the API returns the same stats for each search, so a spreadsheet or a short script can rank every candidate by speed, spread and margin. Automating sold comps shows how.
Asking prices tell you what people want to sell. Sold comps tell you what people actually buy. Research with the second one.
Frequently asked questions
How do you use sold comps for market research?
Look up recent sold listings for the product and measure four things: how often it sells, how wide the price range is, how much of the market is lots, parts or fakes, and whether the median price leaves a margin over what you'd pay. Compare candidate products on the same four numbers.
Why use sold prices instead of asking prices for research?
Asking prices show what sellers hope for. Many listings never sell, or sell after price drops. Sold prices are what buyers actually paid, so they measure real demand at real prices.
How can I tell how fast a product sells on eBay?
Count the sales in the sold listings and divide by the number of days they cover. Two hundred sales in a week is a fast market. Sixty sales in two months is a slow one. For saturation, compare sold listings with active listings (the sell-through rate).
What does a wide price range tell me?
That buyers don't agree on a price, usually because the search mixes versions, sizes, conditions or fakes. It makes a product harder to price and riskier to stock. Narrow the search, and if the range stays wide, treat the median with caution.